Introduction
Fatigue failure is deceptive. Unlike a static overload that bends or breaks a part visibly, fatigue damage accumulates silently under repeated loading, sometimes for thousands of cycles, before triggering sudden, catastrophic fracture at stress levels well below the material's tensile strength.
For engineers specifying A356-T6 aluminum castings, this is a core concern. The alloy is widely used in components that endure millions of load cycles in service — rotational mold tooling, structural housings, suspension parts, and specialty castings among them. ASM International reports that fatigue accounts for approximately 90% of all service failures due to mechanical causes in metallic materials. For design engineers, that figure makes fatigue analysis non-negotiable.
Rotational mold manufacturers face this directly. Cast aluminum molds cycle through repeated thermal and mechanical loading in production — and a mold that fatigues prematurely doesn't just fail; it shuts down a production line.
What makes A356-T6 particularly challenging is that its fatigue performance isn't a fixed material property. Two castings with identical chemistry and heat treatment can deliver vastly different service lives depending on what happened in the foundry. That connection between casting quality and cyclic durability is what this article explores.
Key Takeaways
- A356-T6 fatigue life is controlled primarily by casting defects — not base material properties
- Defective castings show at least an order of magnitude lower fatigue life than defect-free (HIP-treated) material
- Secondary dendrite arm spacing (SDAS) governs fatigue limits when defects are absent — finer SDAS means longer life
- Critical defect size threshold sits around 25–50 µm; below this, failure mode shifts away from the defect itself
- Dense castings, tight SDAS control, and HIP treatment for critical parts are the most reliable path to fatigue resistance
What Is A356-T6 Fatigue Behavior — and Why Does It Matter?
A356-T6 is a hypoeutectic Al-7%Si-0.3%Mg casting alloy. The "T6" condition means it has been solution treated (typically at 540°C), water quenched, and artificially aged, producing peak strength through precipitate hardening.
"Fatigue behavior" describes how this material responds to cyclic, repetitive loading over time: the dominant failure mode in rotating shafts, wheels, suspension arms, and any component subjected to oscillating mechanical or thermal loads.
Where Fatigue Performance Is Critical
A356-T6 castings appear in applications where cyclic loading is unavoidable:
- Automotive: Wheels, knuckles, control arms, engine components
- Aerospace: Structural brackets and housings exposed to vibration
- Industrial: Pump housings, rotational molds, and structural enclosures
- Rotational molding tooling: Molds that undergo repeated heating and cooling cycles in production
In all of these, fatigue failure — not static overload — is the primary design concern.
HCF vs. LCF for A356-T6
Two fatigue regimes matter here:
- High-cycle fatigue (HCF): Stress amplitudes below yield strength, typically above 10⁵ cycles. This is the dominant mode for most A356-T6 applications, and S-N (stress vs. cycles) curves are the primary design tool.
- Low-cycle fatigue (LCF): Higher strain amplitudes, fewer cycles — relevant in thermal cycling or severe overload conditions.
For most structural A356-T6 applications, HCF governs design. Scatter in fatigue data for cast alloys is exceptionally high compared to wrought materials, because defect populations vary from casting to casting, even within the same production run. This is why casting process control — particularly achieving dense, uniform microstructures — directly determines how reliably a component performs under cyclic load.
Key Factors That Govern A356-T6 Fatigue Performance
Casting Defects — Porosity and Oxide Films
Porosity and oxide films are the dominant crack initiation sites in A356-T6. Research by Wang, Apelian, and Lados on Sr-modified A356-T6 found that castings with defects show at least an order of magnitude lower fatigue life than defect-free, HIP-treated material.
Porosity is more detrimental than oxide films for geometric reasons. A pore creates a three-dimensional stress concentration that drives crack fronts differently than a planar oxide bifilm, and the local stress amplification at a pore is typically higher — accelerating initiation.
Critical Defect Size Threshold
Not all defects matter equally. Wang et al. identified a critical initiating defect size of approximately 25 µm for pores and 50 µm for oxide films in Sr-modified A356-T6 under cyclic loading. Below these thresholds, crack initiation shifts away from the defect itself — toward eutectic Si particles or slip bands.
Reducing defect size below these thresholds doesn't just lower fatigue damage incrementally — it changes the failure mechanism entirely and can substantially extend component life.
Secondary Dendrite Arm Spacing (SDAS)
In defect-free castings, SDAS becomes the primary microstructural variable governing fatigue performance. SDAS is the spacing between secondary dendrite arms formed during solidification — finer spacing results from faster cooling rates.
- Finer SDAS → smaller dendrite cells → smaller eutectic silicon particles → improved fatigue resistance and ductility
- Coarser SDAS → larger cells → more damaging microstructural features
SDAS is directly controlled by solidification rate, which is determined by mold thermal design, wall thickness, and process parameters. It's one of the most accessible levers foundries have for improving fatigue performance without changing alloy chemistry.
Microstructural Constituents
When gross defects are absent, microstructural constituents govern fatigue behavior:
- Eutectic Si morphology: Unmodified acicular (needle-like) Si particles are more damaging crack initiators than the globular particles produced by strontium modification. Sr-modified A356 delivers meaningfully better fatigue performance.
- Iron-rich intermetallics: Higher Fe content (>0.55 wt.%) promotes brittle Fe-rich intermetallic compounds that act as crack initiation sites. Low-Fe A356-T6 (<0.1 wt.%) shows improved fatigue performance, as confirmed by Yi et al. (2004).
- Mg content: Influences precipitation hardening response during T6 treatment, affecting strength-fatigue balance.
Stress Ratio Effects
The stress ratio R (minimum stress ÷ maximum stress) affects crack growth rate significantly. Wang et al. measured approximately 60 MPa at 10⁷ cycles under R = 0.1 versus ~90 MPa at R = -1 in Sr-modified A356-T6.
The higher limit at R = -1 reflects fully reversed loading, where the compressive half-cycle drives crack closure — raising the apparent threshold stress. At R = 0.1 (tensile-dominant cycling), crack closure benefits are reduced, yielding lower measured fatigue limits. The roughly 30 MPa difference between these two conditions is practically significant for component design.
How A356-T6 Fatigue Damage Progresses
Stage 1 — Crack Initiation
In defective castings, fatigue cracks initiate almost exclusively at pores, oxide films, or shrinkage cavities — often skipping the extended initiation period seen in wrought alloys. In HIP-treated (defect-free) castings, initiation shifts to eutectic Si particles or slip bands, and this initiation period becomes a significant fraction of total fatigue life.
Location matters: surface and near-surface defects are more damaging than internal ones. They experience maximum stress amplitude and have unrestricted access to the crack front.
For context, McDowell et al. (2003) modeled that incubation life (the period before a crack becomes mechanically significant) accounts for 50–70% of total HCF life in HIP-treated A356-T6 with 50 µm pores — but drops to only 20–30% when pore size reaches 200–400 µm. Larger defects simply eliminate the useful initiation period.
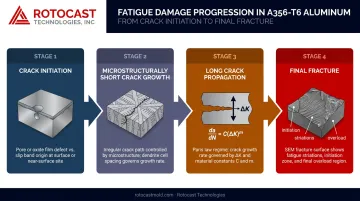
Stage 2 — Microstructurally Short Crack Growth
Once initiated, cracks propagate through individual dendrite cells in an irregular, microstructure-influenced path. SDAS, eutectic particle distribution, and grain boundary interactions all redirect and retard the crack front at this scale. Classical linear elastic fracture mechanics (LEFM) does not apply at this scale. The stage is difficult to model and represents a larger fraction of total life in defect-free castings.
Stage 3 — Long Crack Propagation
Once the crack spans several dendrite cells, LEFM takes over. Crack growth follows the Paris-Erdogan equation:
da/dN = C · ΔKᵐ
where da/dN is crack growth per cycle, ΔK is the stress intensity factor range, and C and m are material constants. McDowell et al. reported constants for A356-T6 horizontally cast plate: m = 4.2 and C = 1.5 × 10⁻¹¹ m(MPa√m)⁻⁴·²/cycle. This stage connects measured defect size directly to propagation life, making it the critical input for quantitative life prediction.
Crack closure also operates during Stage 3. During the compressive portion of a load cycle, crack faces contact and partially close, reducing the effective ΔK driving crack growth. This effect depends on stress ratio R and defect geometry, and advanced predictive models account for it explicitly.
Stage 4 — Final Fracture
Fracture occurs when the crack reaches a critical length where the maximum stress intensity factor (K_max) exceeds the material's fracture toughness (K_IC). On fracture surfaces examined by SEM, three distinct zones are visible:
- Initiation site — identifies the originating defect (pore, oxide film, or inclusion)
- Fatigue striations — mark stable crack growth and can be used to estimate propagation rate
- Overload fracture zone — confirms the final failure event
Engineers use SEM fractography to confirm failure mode and measure initiating defect dimensions after fracture.
Analyzing A356-T6 Fatigue Life: Key Methods and Predictive Tools
S-N Curves and Their Limits
S-N testing plots stress amplitude against cycles to failure for multiple specimens at each stress level. For A356-T6, scatter is high — because defect populations vary. A single S-N curve cannot capture the range of performance produced by different casting conditions. Engineers use S-N data with matched SDAS and defect conditions to establish design allowables, but must treat these curves as conditional, not universal.
Weibull Statistical Analysis
The two-parameter Weibull distribution is the standard tool for characterizing A356-T6 fatigue scatter. Wang et al. reported Weibull shape parameters (moduli) of:
| Failure Mode | Weibull Modulus |
|---|---|
| Porosity-initiated | 1.7 |
| Oxide film-initiated | 1.8 |
| Slip band-initiated | 2.0 |
Lower moduli indicate higher scatter. Weibull analysis translates raw fatigue data into probabilistic reliability statements — essential for safety-critical component qualification.
Fracture Mechanics-Based Life Prediction
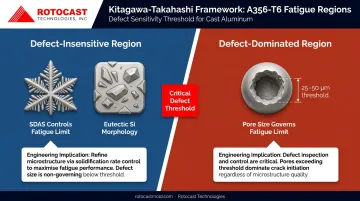
Defect size measured by X-ray or computed tomography (CT) can serve as an input to Paris-law calculations, predicting the number of propagation cycles from initial defect to final fracture. Tenkamp et al. (2018) applied CT-based Kitagawa-Takahashi diagrams directly to A356-T6, correlating fatigue limit with porosity size and connecting nondestructive inspection data to quantitative life prediction.
The Kitagawa-Takahashi diagram maps two regimes: a defect-insensitive region (where SDAS and microstructure govern fatigue limit) and a defect-dominated region (where defect size controls everything). It provides a practical tool for setting inspection limits and predicting when defect size becomes life-critical.
Machine Learning Approaches
Recent work has applied support vector regression (SVR), Random Forest (RF), and Gaussian Process Regression (GPR) trained on empirical A356-T6 fatigue data to predict fatigue limits from SDAS and defect size inputs. Published metrics include SVR achieving R² = 0.957, RMSE = 1.97 MPa on A356-T6 data, with cross-alloy transferability to A357-T6 at SDAS = 38 µm. At that accuracy level, these models meaningfully reduce the number of physical test specimens required to establish design allowables.
A Practical Example: How Defect Size Changes Fatigue Outcomes
Consider three A356-T6 specimens tested under fully reversed loading (R = -1), all from the same alloy and T6 condition:
| Specimen | Condition | Approximate Fatigue Limit at 10⁷ cycles |
|---|---|---|
| A | HIP-treated, defect-free | ~90 MPa |
| B | Small pore (~50 µm) | ~84 MPa |
| C | Large pore (>200 µm) | Significantly reduced; initiation period collapses |
In Specimen A, crack initiation accounts for 50–70% of total life — the alloy earns its fatigue limit. In Specimen C, the large pore dominates from the first cycle, collapsing that initiation period entirely. Same alloy, same heat treatment, radically different outcomes.
The Key Lesson
The fatigue limit is not a material constant for A356-T6 — it's a process outcome. The same alloy chemistry, in the same T6 condition, delivers dramatically different service lives depending on casting quality. Specifying "A356-T6" by chemistry and heat treatment alone — without controlling defect population and SDAS — is the most common and consequential mistake engineers make when sourcing cast aluminum components.
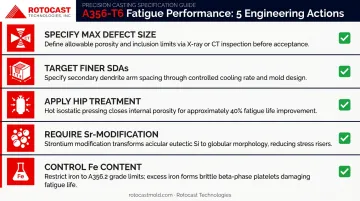
Practical Engineering Levers
To translate this understanding into manufacturing decisions:
- Specify maximum allowable defect size via X-ray or CT inspection, not just chemistry requirements
- Target finer SDAS through mold thermal management — wall thickness, cooling rate, and gating design all influence this directly
- Apply HIP treatment for fatigue-critical applications; a 2008 study on sand-cast A356 found HIP increased fatigue resistance by approximately 40% while reducing scatter
- Require Sr-modification to refine eutectic Si morphology and reduce brittle particle sizes
- Control Fe content — specifying A356.2 (with strict impurity limits and primary aluminum ingot) directly reduces iron-rich intermetallics
How Rotocast Technologies Delivers Fatigue-Resistant A356-T6 Castings
The science above is only useful if it's applied at the foundry level. Fatigue performance in cast aluminum is ultimately a manufacturing problem — solved by process control, not just alloy selection.
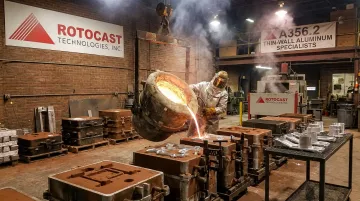
Rotocast Technologies has built its 70-year history in Akron, Ohio around exactly this principle. Their in-house foundry specializes in sand casting with A356.2 grade aluminum — a designation that matters metallurgically.
The ".2" suffix specifies strict chemical limits and primary aluminum ingot, meaning lower impurity content, fewer iron-rich intermetallics, and inherently better fatigue properties before any process optimization begins.
Their workforce, averaging 16 years of experience in specialty casting, applies that expertise to the specific challenge of thin-walled castings (typically ¼" to 3/8" wall thickness). Thinner walls solidify faster, producing finer SDAS. Finer SDAS means smaller eutectic particles, denser microstructure, and measurably better fatigue performance — which is why Rotocast's claim of "best dense castings in the industry" carries direct metallurgical significance.
Their veteran pattern makers collaborate with the foundry team from the earliest tooling design stages — optimizing parting lines, gating geometry, and thermal layout for consistent metal flow across complex shapes. That upstream process control is what determines whether a finished casting has 50 µm defects or 500 µm defects, and whether it survives thousands or millions of service cycles.
For rotational mold manufacturers and product designers sourcing aluminum castings where cyclic loading matters, those variables converge in one place:
- A356.2 alloy — tighter chemistry limits than standard A356, fewer fatigue-initiating intermetallics
- In-house foundry control — no outsourced casting steps, full process ownership from pattern to pour
- Thin-wall expertise — ¼" to 3/8" walls optimized for fine SDAS and dense microstructure
- Pattern-to-foundry collaboration — tooling geometry designed for fatigue performance, not just dimensional accuracy
Contact Rotocast at sales@rotocastmold.com or 330-203-2335 to discuss your fatigue performance requirements and get castings built for durability.
Frequently Asked Questions
What is the typical fatigue strength of A356-T6 aluminum alloy?
Fatigue strength depends heavily on casting quality. In defect-free (HIP-treated) conditions under fully reversed loading (R = -1), A356-T6 fatigue limits can reach approximately 90 MPa at 10⁷ cycles. Castings with significant porosity may exhibit limits as low as 58–65 MPa. This range makes process control more consequential than alloy selection alone.
How do casting defects affect the fatigue life of A356-T6?
Porosity and oxide films act as crack initiation sites that can reduce fatigue life by an order of magnitude compared to defect-free castings. Porosity is more detrimental than oxide films due to higher local stress concentration geometry. Defect size correlates directly with fatigue life reduction — larger defects eliminate the crack initiation period entirely.
What is SDAS and how does it influence A356-T6 fatigue behavior?
Secondary dendrite arm spacing (SDAS) reflects solidification rate: faster cooling produces finer SDAS, which correlates with improved fatigue resistance and ductility. SDAS is controlled through mold thermal design, wall thickness, and process parameters — making it a key variable in casting quality optimization.
Does HIP treatment improve the fatigue life of A356-T6 castings?
Yes. Hot Isostatic Pressing (HIP) closes internal porosity and substantially extends fatigue life, with one study reporting approximately a 40% fatigue resistance increase in sand-cast A356. HIP-treated castings approach defect-free performance, though the added cost limits use to aerospace and other high-reliability applications.
What is the critical defect size for fatigue crack initiation in A356-T6?
Research identifies a threshold of approximately 25 µm for pores and 50 µm for oxide films in Sr-modified A356-T6. Below these sizes, crack initiation shifts to eutectic Si particles or slip bands rather than the defect itself, shifting the failure mechanism and extending fatigue life.
How is A356-T6 fatigue life predicted in practice?
Engineers combine S-N curves, Weibull statistics, and fracture mechanics (Paris-Erdogan law) to predict fatigue life from measured defect sizes. CT-based Kitagawa-Takahashi diagrams link inspection data to fatigue limit predictions. Machine learning models using SDAS and defect size as inputs are emerging as efficient alternatives to large-scale physical testing.